

Running tests and reading reports
Starting a run
Section titled “Starting a run”Tests are run from the editor:
- Choose the environment in the selector above the steps.
- Optionally turn on Watch.
- Choose Run test.
You need a role with the Run tests permission (everyone except Viewer). Deprecated tests cannot be run.
Runs can also be started from the command line (atx run) or
the REST API (POST /api/runs).
Run executes the saved version
Section titled “Run executes the saved version”A run always executes the saved test. With unsaved edits you are asked to choose Run saved version or Save and run.
Watch: see the browser
Section titled “Watch: see the browser”By default, tests run headless (no visible window). Watch opens the browser so you can see it drive the application. In a hosted setup the window opens on your computer through the AutoTestX Agent. If the agent isn’t running, AutoTestX helps you set it up before the run starts.
Data-driven runs with Watch on run their rows one at a time.
Live results
Section titled “Live results”While a run is in progress:
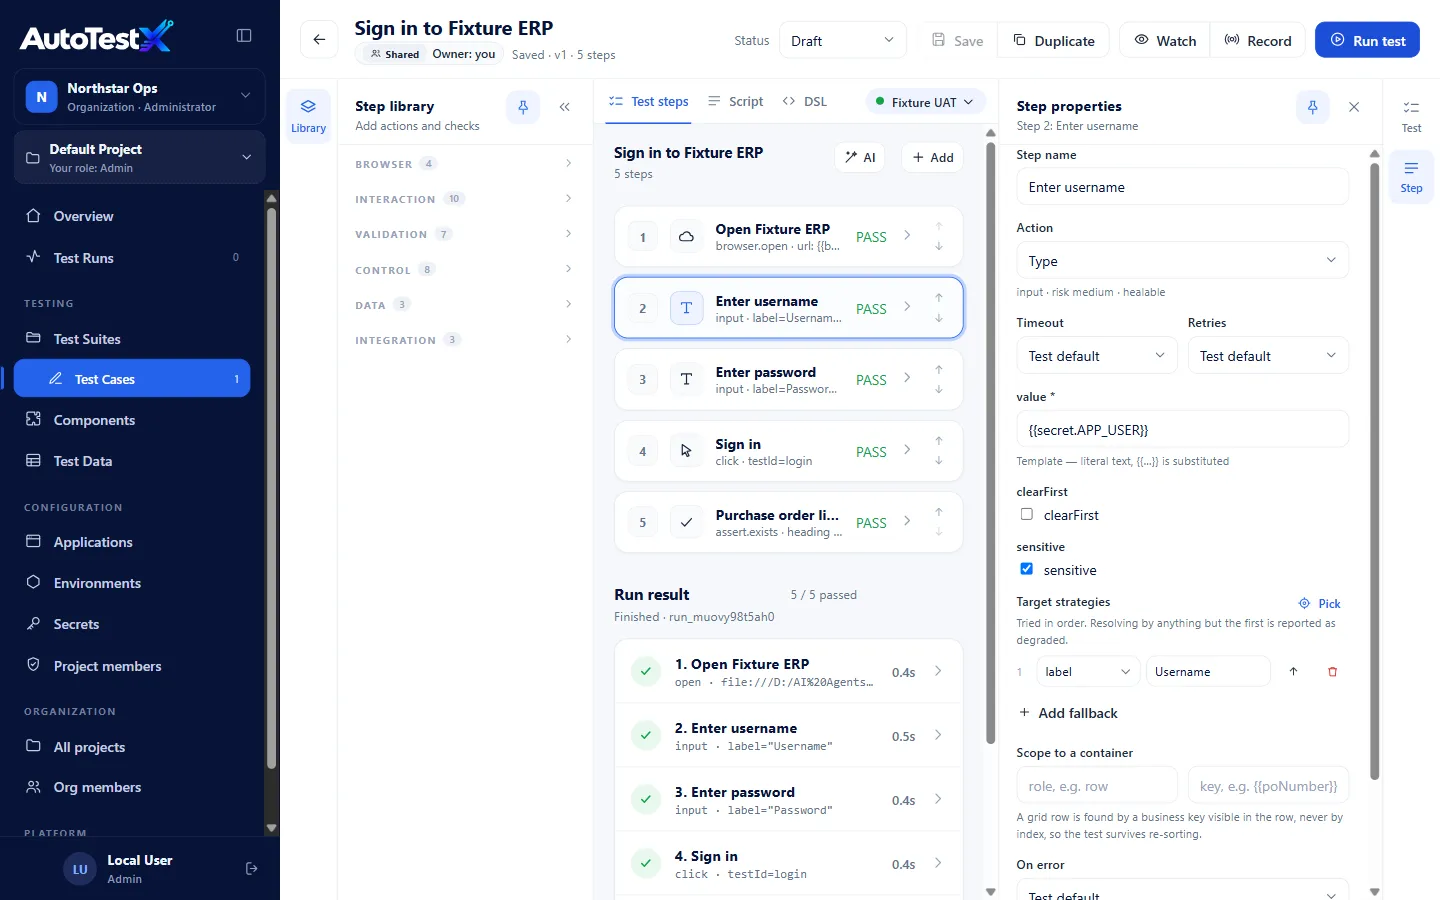
- each step in the editor shows PASS, FAIL, WARN or SKIP as it finishes,
- the Run result panel under the steps lists each step with what it actually did (address opened, locator matched, value typed) and how long it took,
- RESULT shows steps passed out of the total.
Test Runs
Section titled “Test Runs”Test Runs in the sidebar lists every run in the project, newest first.
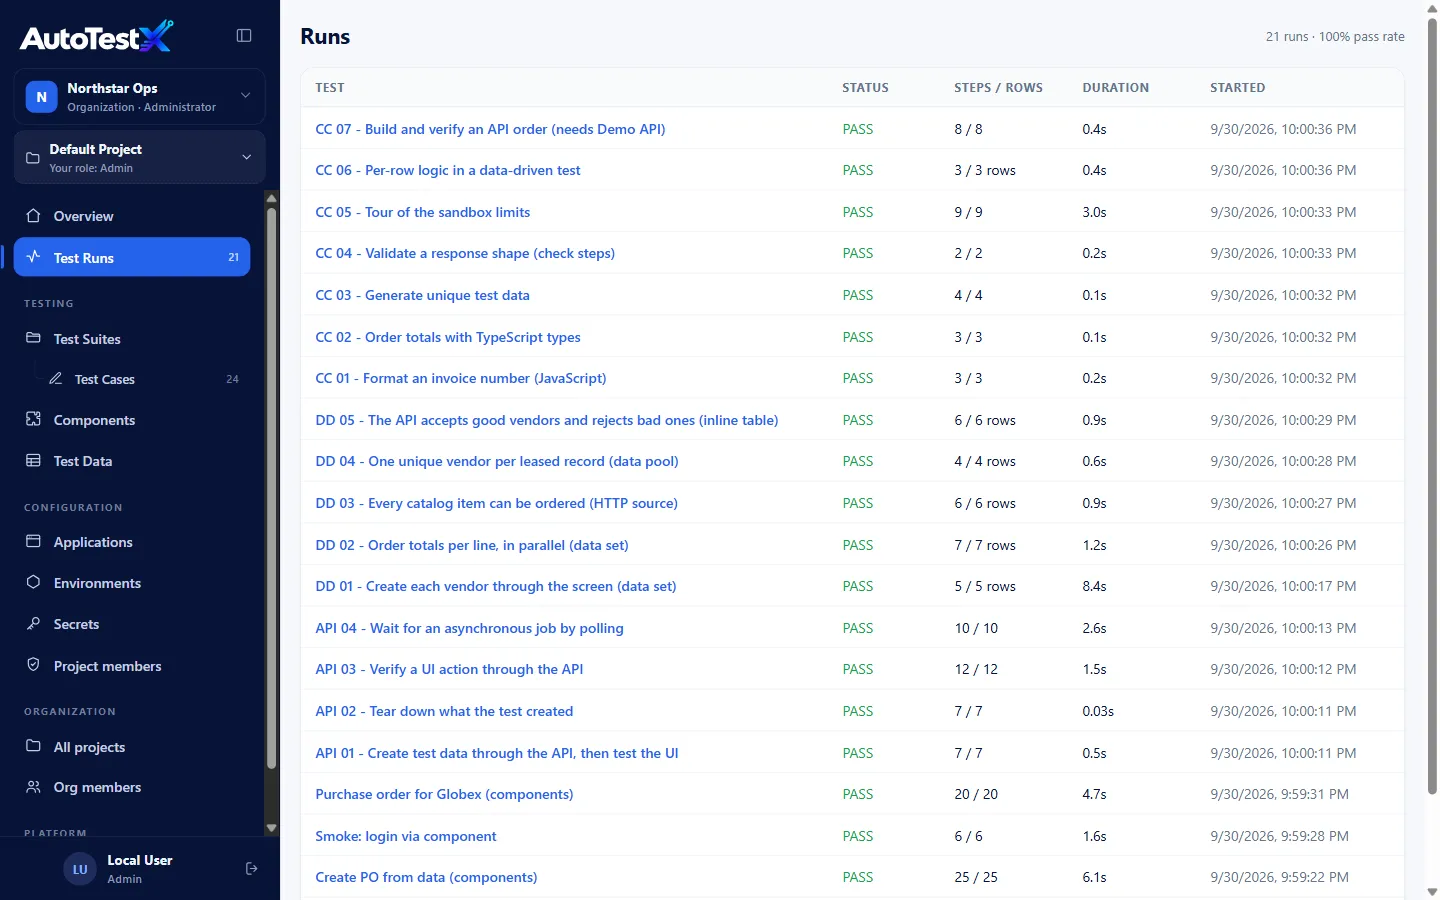
| Column | Meaning |
|---|---|
| Test | The test that ran |
| Status | PASS, FAIL or ERROR |
| Steps / rows | Steps passed / total, or rows passed / total for a data-driven run |
| Duration | Wall-clock time |
| Started | When it started |
The heading shows the number of runs and the overall pass rate. Choose a run to open its report. Runs of a private test are visible only to the test’s owner.
The run report
Section titled “The run report”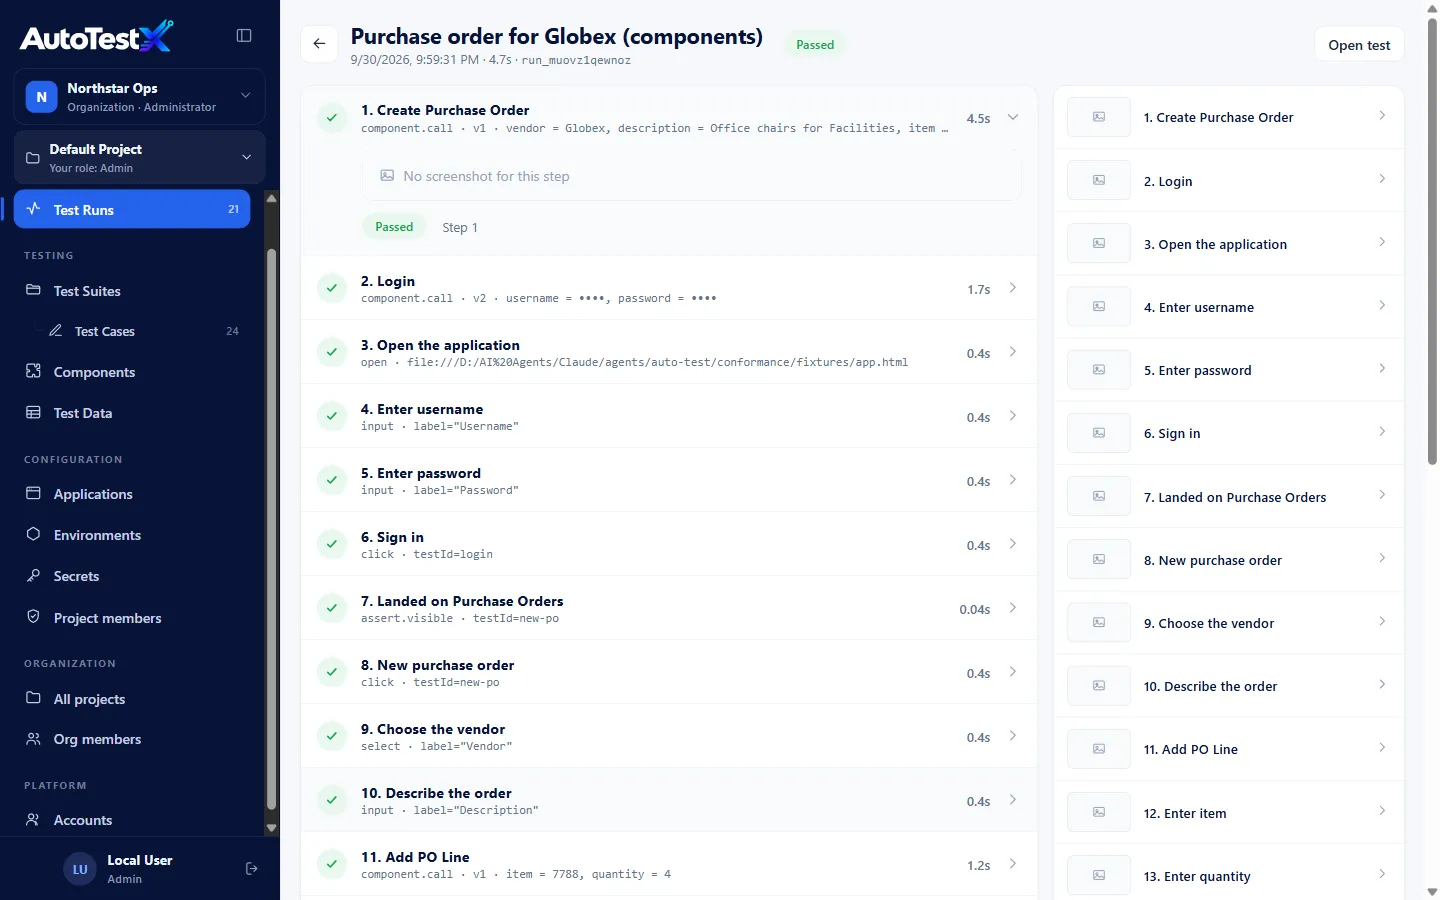
Header
Section titled “Header”The test name, status (Passed, Failed, Error), start time, duration, run id, and Open test.
Each step is a card, numbered in execution order. Steps inside loops and components are numbered too. A card shows:
- the status icon: ✓ passed, ✕ failed,
!warned,–not run, - the step name, the action, and the detail as executed: the real URL (not
{{baseUrl}}), the locator that matched, the values used (secrets as••••), - the duration.
Expand a card to see:
- the screenshot taken after the step (or at the moment of failure),
- Primary locator or Fallback locator: which strategy found the element,
- for a failed assertion, expected and actual side by side,
- the error message.
Component calls show the component’s name, its pinned version and the arguments, with the component’s own steps listed after it.
Jump list and screenshots
Section titled “Jump list and screenshots”The right-hand column lists every step with a thumbnail. Choose one to jump to it. Choose a screenshot to open the viewer. Use ← / → to step through every screenshot in order, and Esc to close.
Run summary
Section titled “Run summary”Counts of Passed and Failed steps and Evidence images, plus the final value of
every Variable the run produced (e.g. poNumber = "PO-102938"). Secret values never
appear here.
When screenshots are taken
Section titled “When screenshots are taken”| How the run started | Screenshots |
|---|---|
From the editor, or POST /api/runs |
After every step, plus on failure. The API accepts "screenshots": false to turn this off. |
CLI (atx run) |
On failure and for Screenshot steps. Add --screenshots for every step. |
Screenshot steps always capture, whatever the setting.
Inside a loop, each iteration keeps its own screenshot, so the report shows the right screen for every iteration.
Reading a failure
Section titled “Reading a failure”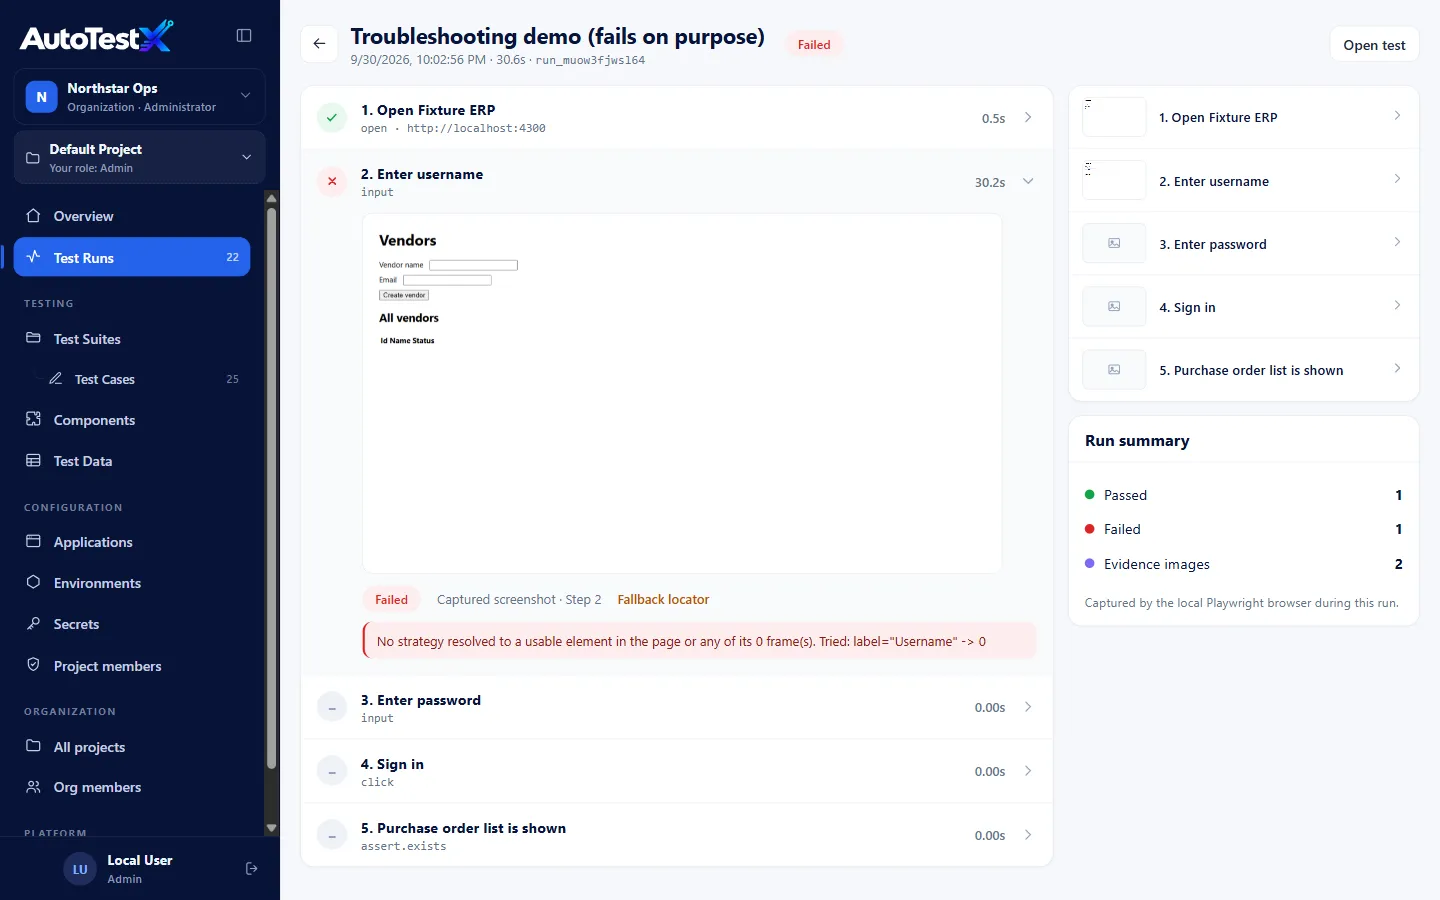
-
Find the first ✕ step. Steps after it show
–(not run) when the test aborted. -
Expand it and read the error. Common errors:
Error says Meaning No strategy resolved to a usable element… Tried: label=“Username” -> 0 No locator found the element. -> 0means 0 matches. Compare the screenshot with what the step expected. Often the wrong page, wrong environment, or a changed screen.expected … actual … An assertion compared values and they differed Unresolved reference “x” A {{x}}with no value: a typo, or the step that sets it did not runTimeout … exceeded The element or page did not get ready within the step’s timeout Cannot compare string with number An expression mixed types. Convert with NUMBER(). -
Look at the screenshot of the step before. It shows the screen the failing step started from.
More in Troubleshooting.
Warnings and drift
Section titled “Warnings and drift”A step that passed using a fallback locator shows ! (warned) and Fallback
locator. The run still passes, but the dashboard lists the test as drifting. Update the
target (use Pick) before the fallback stops working too.
Data-driven run reports
Section titled “Data-driven run reports”A test with a data source runs once per row and produces one run with a result per row.
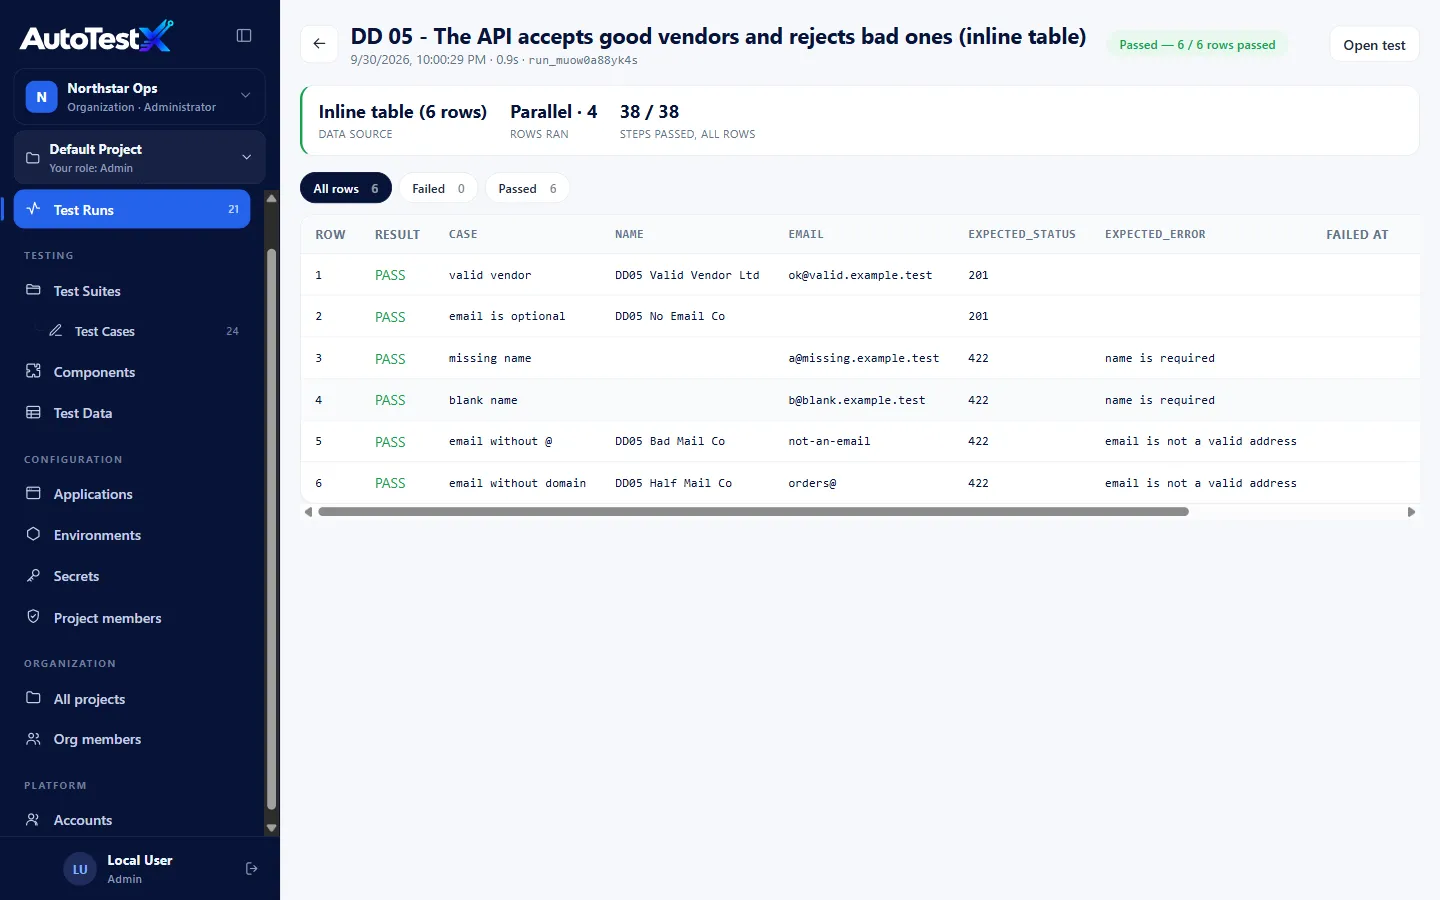
- The summary shows the data source, whether rows ran Parallel · n or Sequential, and steps passed across all rows.
- Filter the table with All rows, Failed, Passed.
- Each row shows its result, its input values (sensitive columns masked), the step it failed at, steps passed and duration.
- Choose a row to see its full step-by-step results and screenshots.
The run’s status:
| Rows | Run status |
|---|---|
| all passed | Passed |
| any failed | Failed |
| some errored, none failed | Error |
| no rows at all | Error (an empty data source is never green) |