

Dashboard
Overview in the sidebar opens the project dashboard. Everything on it is calculated from the project’s tests and run history each time you open it. Nothing is maintained separately, so it cannot go out of date.
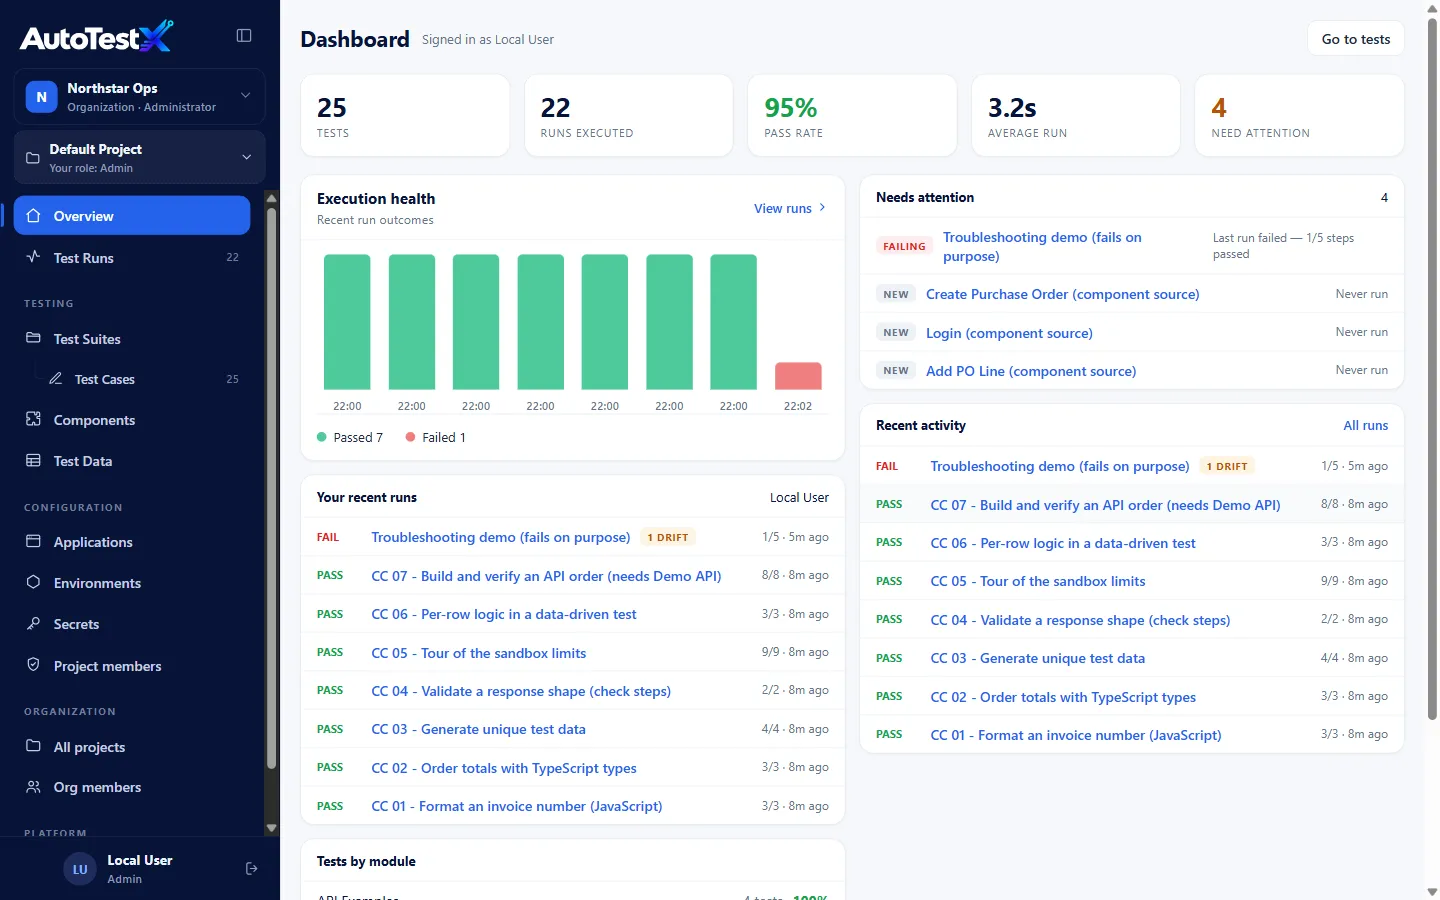
Headline figures
Section titled “Headline figures”| Tile | Meaning |
|---|---|
| Tests | Test cases you can see in this project |
| Runs executed | Runs recorded in the project |
| Pass rate | Share of finished runs that passed |
| Average run | Average run duration |
| Need attention | Tests in the Needs attention list (below) |
Execution health
Section titled “Execution health”A bar per recent run, green for passed and red for failed, with the time it ran. View runs opens Test Runs.
Your recent runs / Recent activity
Section titled “Your recent runs / Recent activity”Your recent runs lists runs you started. Recent activity lists everyone’s runs in
the project. Each line shows the result (PASS / FAIL), the test, steps passed (e.g.
8/8) and when it ran. Choose a test name to open its run report.
A DRIFT badge means some steps in that run found their element only through a fallback locator, not the first one. The run may still have passed. Drift is the early warning that the application has changed under the test. See Element targets.
Tests by module
Section titled “Tests by module”Tests grouped by suite, with the number of tests and the suite’s pass rate. Tests with no suite are counted under Unsorted.
Needs attention
Section titled “Needs attention”The tests that most need someone to look at them, most urgent first:
| Label | Meaning |
|---|---|
| FAILING | The latest run failed or errored. The line says how many steps passed. |
| DRIFTING | The latest run passed, but n steps resolved by a fallback locator. Update the targets before they break. |
| NEW | The test has never been run. |
“Nothing to chase” means every test has run, passed, and resolved its elements by their first locator.